 Prometheus
Prometheus is an Open-Source pull-based metrics-based monitoring system written in Go and is licensed under Apache-2. It is part of the Cloud Native Foundation.
Architecture
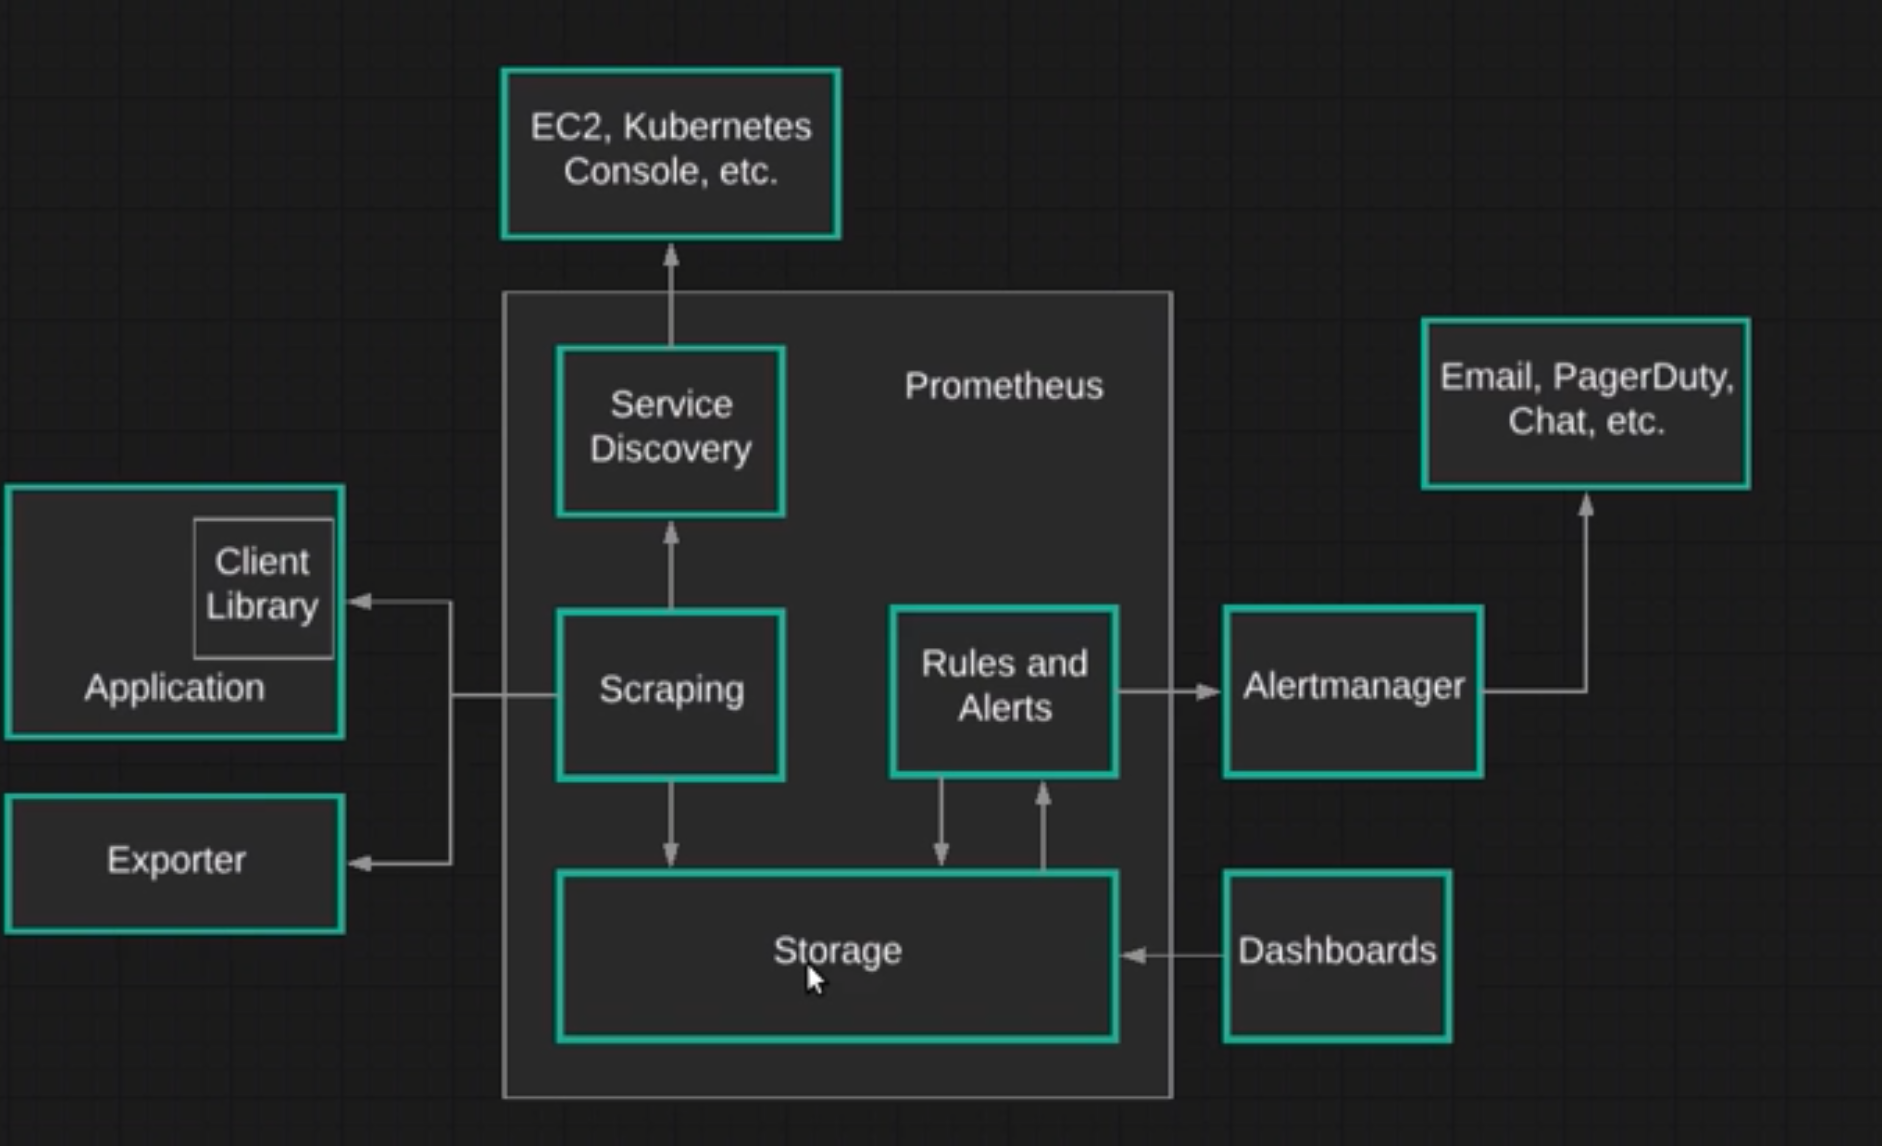
Prometheus can be a service that will be run in a pod. It has 4 main components:
- Storage - Uses the storage provided by k8 to store data
- Scraping - Gets metrics from an application, it can get this data via:
- Client Library - A library will help to instrument data, that will be exposed by HTTP endpoint (/metrics)
- Exporter - An exporter is any application that exposes metric data in a format that cna be collected by Prometheus. Used to instrument services that we don't have the source code (MySQL, HAProxy). It uses a sidecar container to do that.
- Service Discovery - Gets Kubernetes metrics, by using labels that will be used to filter pods pods to fetch data.
- Alert Manager - Allows to create rules and alerts that will trigger a notification that can be passed to other systems (Email, PageDuty, Slack)
- Dashboards - UI to visualise this data.
Allowing Push
By default Prometheus is pull-based, but in some cases you might need to push metrics instead of pulling them (eg. you have a job that lives for short period). To do that we can use Prometheus Pushgateway, which is a middle man that can be used to push/store metrics and over time prometheus will pull those metrics.
Monitoring
Service discoverability
Prometheus needs to know how to scrape data from services. There are 3 main ways to do that
Editing Prometheus Config
The most simple is to configure it in prometheus kubernetes yaml. To do that just define
scrape_configs:
	- job_name: 'Linux Server'
	  static_configs:
	  - targets: ['172.31.110.170:9100']
This is quite limiting and requires manual work, so the next two ways are a bit better
Pod Monitor
Pod monitor works for cases were your pods or deployments do not handle traffic from or to other applications running inside/outside your cluster. Its configuration needs a selector to work (like a kubernetes deployment
apiVersion: monitoring.coreos.com/v1
kind: PodMonitor
metadata:
  name: example-app
  labels:
    team: frontend
spec:
  selector:
    matchLabels:
      app: example-app
  podMetricsEndpoints:
  - port: web
Service Monitor
Allows you to observe a singular service and will hit the endpoint you decided connecting to a specific port in your service:
apiVersion: monitoring.coreos.com/v1
kind: ServiceMonitor
metadata:
  name: default-service-monitor
  namespace: monitoring
  endpoints:
    - interval: 10s
      path: /metrics
      port: metrics  # will connect to this port
      scheme: http
  jobLabel: app.kubernetes.io/name
  namespaceSelector:
    any: true
  sampleLimit: 1000
  selector:
    matchExpressions:
      - key: app.kubernetes.io/name # Will scrape in case this exists
        operator: Exists
---
apiVersion: v1
kind: Service
metadata:
  labels:
    app.kubernetes.io/name: my-custom-service  # label definition
  name: my-custom-service
  namespace: monitoring
spec:
  ports:
    - name: metrics  # port that matches
      port: 9100
      protocol: TCP
      targetPort: 9100
  selector:
    app.kubernetes.io/name: my-custom-service
Instrumenting applications
Collecting metrics
Prometheus Data Model
Time Series
Prometheus is build around storing time-series data. Time series data consists of a series of values associated with different points in time. All data in prometheus is stored as time series.
10:00 - 5
10:03 - 9
10:05 - 2
10:10 - 12
Metric and labels
Every metric in Prometheus has a name. This name refers to a system feature that is being measured. eg. node_cpu_seconds_total
But if we query by this metric we will get a lot of information from different applications and services, which in most cases it is not what we want. To solve this we can add labels to the metric which will work as metadata that can be used for us to query more specific data. eg. node_cpu_seconds_total{app="todo", env="production"}
Metric Types
Metric types are different strategies which exporters use to represent data. This is not represented in any special way in prometheus server, but without those strategies the data there would be quite simple.
- Counter - is a single number that can only increate or be reset to zero. Counter represent cumulative values such as number of requests, records processed, error count and so on
- Gauge - is a single number that can change over time to higher or lower values. For example, number of requests per second, cpu usage, current active threads
- Histogram - Counts the number of observations/events that fall into a series of different buckets, each one with their time series. Eg. number of requests that take less than x
http_request_duration_seconds_bucket{le="0.3"} http_request_duration_seconds_bucket{le="0.9"}This buckets are cumulative, so 0.9 will contain 0.3 requests too They will also include 2 other metrics called _sum and _count - Summary - Summaries are like histogram, but the are focused on percentile values. It can find things like p95 of requests.
PrompQL
PrompQL is a language that allow you to query metric data from Prometheus. You can use this query on expression browser, prometheus API and visualization tools like Grafana.
Queries
Selectors
The most basic component to a PrompQL query is a time-series selector. This selector is the metric name, optionally combined with labels and other modifiers.
Simple query - node_cpu_seconds_total
Filtering by label - node_cpu_seconds_total{app="todo", env="production"}
Label Matching
Label filters can have different types of matchers:
- = - Equals
node_cpu_seconds_total{env="production"} - != - Not equal
node_cpu_seconds_total{env!="production"} - =~ - Regex match
node_cpu_seconds_total{env~="prod.*"}Finds all metrics with label named env that start with prod - !~ - Regex do not match
node_cpu_seconds_total{env!~"prod.*"}Finds all metrics with label named env that does not start with prod
Range Vector Selectors
Allow you to select data points in a certain time range.
Eg. I want to get the last 2 min metrics - node_cpu_seconds_total{env="production"}[2m]
Offset modifier
Allow you to say how long time ago you want to fetch this metrics.
Eg. I want to select metrics from one hour ago with a range of 5 min node_cpu_seconds_total[5m] offset 1h
Operators
Allow you to perform calculations based on metrics.
Arithmetic Binary Operators
- Addition
- Subtraction
- Multiplication
- / Division
- % Modulo
- ^ Exponentiation
node_cpu_seconds_total * 2 - Multiplies all data by 2
Matching rules
Allow you to combine or compare records from 2 different sets of metrics. By default matches only happen if all labels are the same, but this can be changed by adding the modifiers ignoring(label_list) or on(label_list)
eg. node_cpu_seconds_total + ignoring(env) node_cpu_seconds_total
Comparison Binary Operations
Allow you to filter results if the comparison evaluates to true.
- == Equal
- != Not equal
Greater than
- < Less than
= Greater than or equal
- <= Less than or equal
node_cpu_seconds_total == 0
In case you don't wanna filter, but get results you can add the keyword bool. Eg node_cpu_seconds_total == bool 0
Logical/Set Binary Operators
Operators that allow you to combine sets of results based on their labels.
- and - Intersection
- or - Union
- unless - Complement
Eg. node_cpu_seconds_total and node_cpu_gues_seconds_total - Return records where the set of labels match to the other set.
Aggregation Operators
Aggregation operators combine multiple values into a single value.
- sum - Add values together
- min - Get the smallest value
- max - Gets the largest value
- avg - Gets the average
- stddev - Gets the standard deviation of all values
- stdvar - Gets the standard variance of all values
- count - Counts number of values
- count_values - Counts number of repeated values
- bottomk - Smallest number (k) of elements
- topl - Largest number (k) of elements
- quantile - Calculate the quantile for a particular dimention
Eg. avg(node_cpu_seconds_total{mode="idle"}) - Gets the average idle time between all cpus
Functions
Provide built-in functionality to aid in the process of writing queries.
- abs() - returns the absolute value
- clamp_max() - returns values, but replaces them with a maximum value if they exceed
- rate - Checks the average per-second rate of increase in a time-series value. It accepts a range.
rate(node_cpu_seconds_total[1h])
Recording Rules
Allow you to pre-compute values of expressions and queries and save the results as their own time-series data on a schedule basis.
To configure recording rules you need to add locations on rule_files in prometheus.yml. The file should contain this structure
groups:
- name: linux_server
  interval: 15s # How frequent this will be calculated
  rules:
  - record: linux_server:cpu_usage # name of the new metric
    expr: sum(rate(node_cpu_seconds_total{job="Linux Server"}[5m])) * 100 / 2 # expression
Visualization
Grafana
Grafana is an open-source analytics and monitoring tool. It allow you to access prometheus data using queries, display results in multiple ways and can create dashboards.
Alerting
Alertmangager is an application that runs in a separate process from Prometheus. It is responsible for handling alerts sent to it by clients such as Prometheus.
Alerts are notifications that are triggered by metric data.
Alertmanager does the following:
- Deduplicates alterts
- Group multiple alerts when they happen around the same time
- Route alerts to the proper destination such as email or Pagerduty Alert manager do not create alerts or determine when they should be sent, prometheus handles this and forwards it to Alertmanager.
Prometheus Alert Rules
Alerts rules are configured in Prometheus in the same way as recording rules. An example rules file with an alert would be:
groups:
- name: example
  rules:
  - alert: HighRequestLatency
    expr: job:request_latency_seconds:mean5m{job="myjob"} > 0.5
    for: 10m
    labels:
      severity: page
    annotations:
      summary: High request latency